SQL · Guides · October 30, 2026 · 9 min read
Data analyst roadmap: what to learn, in what order, and how long it takes
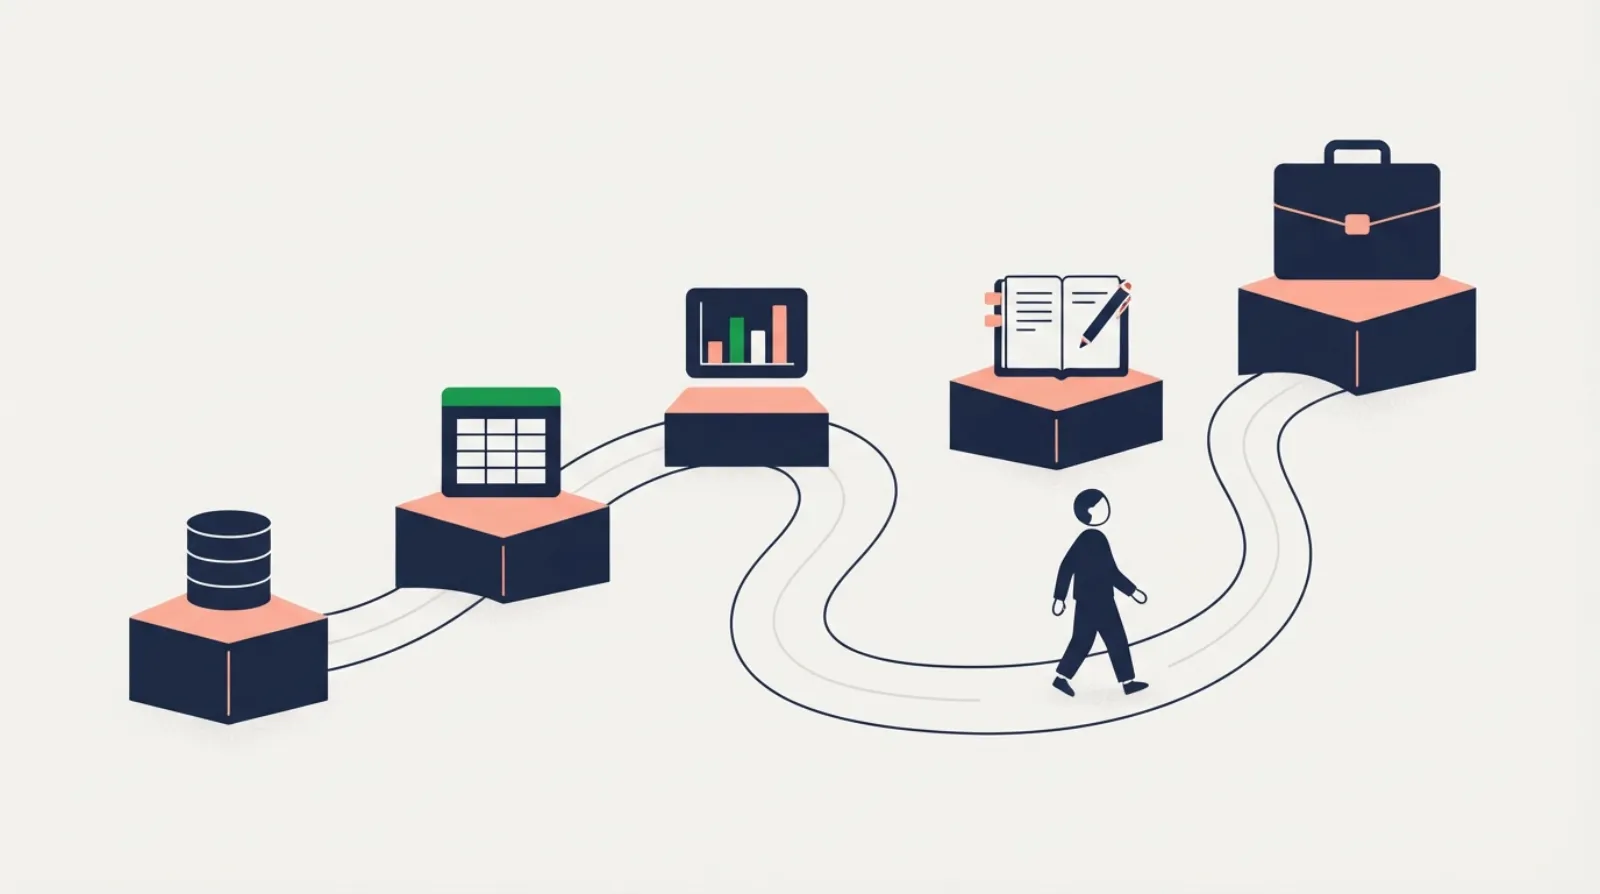
A data analyst’s job is to answer business questions with data: how many, how often, compared to what, and why it changed. The skills follow from that. Learn SQL first, because almost every analyst job involves pulling data from a database. Then spreadsheets for working with results, basic statistics so you do not draw wrong conclusions, and a BI or charting tool to show what you found. Python is useful, but it can come later. Along the way, build a small portfolio and prepare for interviews, which test mostly SQL and how you reason about a business problem.
How long this takes depends on your starting point and your hours, not on a course’s marketing. As a rough guide for someone studying around an hour a day from scratch, getting to the level of a junior job application usually takes somewhere between six months and a year. People who already work with numbers in Excel tend to move faster; people who can only study at weekends, slower. Treat the timeframes below as rough ranges, not promises.
The roadmap at a glance
| Stage | What you learn | Rough time at ~1 hour a day |
|---|---|---|
| 1. SQL basics | SELECT, WHERE, GROUP BY, JOIN, CASE, NULLs |
4–8 weeks |
| 2. Spreadsheets | pivots, lookups, charts, cleaning | 2–4 weeks (less if you use Excel already) |
| 3. Statistics basics | averages vs medians, distributions, percentages, A/B test logic | 4–6 weeks |
| 4. Intermediate SQL | subqueries, CTEs, window functions, dates | 4–8 weeks |
| 5. BI and visualisation | one tool (Power BI, Tableau or Looker Studio), chart choice | 3–6 weeks |
| 6. Business metrics | funnels, retention, cohorts, revenue metrics | ongoing, alongside 4–5 |
| 7. Python (optional at first) | pandas, notebooks, basic plots | 6–10 weeks |
| 8. Portfolio and interviews | 2–4 projects, SQL tasks, case questions | 4–8 weeks |
Stages overlap. You do not need to finish statistics before opening a BI tool; you need to keep moving and keep writing queries.
Stage 1: SQL basics (start here)
SQL comes first for three practical reasons. It is in nearly every analyst job description. It is the skill interviews check most directly, often with a live task. And it is learnable quickly: the core of what analysts write daily is a handful of clauses.
What to learn, in order:
SELECTandFROM: picking columns.WHERE: filtering, includingIN,LIKE,BETWEENandIS NULL.ORDER BYandLIMIT.- Aggregates:
COUNT,SUM,AVG,MIN,MAX. GROUP BYandHAVING.JOIN, especially the difference betweenINNERandLEFT, and what happens when one row matches several.CASEfor if-then logic.
By the end of this stage you should be able to answer a question like “how many flights were in each status?” without looking anything up:
SELECT status, COUNT(*) AS flights
FROM flights
GROUP BY status
ORDER BY flights DESC;| status | flights |
|---|---|
| Arrived | 16707 |
| Scheduled | 15383 |
| On Time | 518 |
| Cancelled | 414 |
| Departed | 58 |
| Delayed | 41 |
(This and the other examples here run on the airline database from the Nomto SQL course: 33,121 flights between 104 airports in summer 2026.)
The habit that matters more than syntax: before writing a query, know what one row of each table represents. Most wrong numbers come from counting rows that are not what you think. The guide to basic SQL queries covers this stage step by step.
Stage 2: spreadsheets
You will still use Excel or Google Sheets constantly: to look at a query result, adjust it, chart it quickly or send it to someone who does not write SQL. Learn pivot tables, lookups (XLOOKUP or VLOOKUP), conditional formulas (IF, SUMIFS, COUNTIFS), basic charts and simple cleaning (trimming spaces, splitting columns, fixing dates).
If you already use Excel at work, this stage may take days rather than weeks. It also makes SQL easier: a pivot table is a GROUP BY, and a lookup is a JOIN. The SQL vs Excel guide maps one onto the other.
Stage 3: statistics basics
You do not need a statistics degree. You need enough to avoid the common wrong conclusions:
- Mean vs median. One very large booking pulls the average up; the median does not move. Know when to report which.
- Distributions. Look at the spread, not just one number. A histogram often tells you more than an average.
- Percentages and rates. What is the denominator? “Cancellations went up” means little if the number of flights also went up.
- Correlation is not causation. Two numbers moving together is a starting point for a question, not an answer.
- A/B test logic. What a control group is, why sample size matters, and what a confidence interval says (and does not say).
A rate always needs a clear denominator. Here is the share of all scheduled flights that were cancelled:
SELECT ROUND(100.0 * COUNT(*) FILTER (WHERE status = 'Cancelled') / NULLIF(COUNT(*), 0), 2) AS cancelled_pct
FROM flights;| cancelled_pct |
|---|
| 1.25 |
Whether 1.25% is good or bad depends on what you compare it with: last month, another route, the target. That comparison is the analyst’s job.
Stage 4: intermediate SQL
Once the basics are routine, add the tools that turn a query into an analysis:
- Subqueries and CTEs (
WITH), for multi-step logic such as averaging daily counts. - Window functions:
ROW_NUMBERfor top N per group,LAGfor comparing with the previous period, running totals and moving averages. - Date functions: truncating to week or month, differences between dates, filling days with no data.
A typical query at this stage, daily flights with a seven-day moving average:
SELECT CAST(scheduled_departure AS DATE) AS day,
       COUNT(*) AS flights,
       ROUND(AVG(COUNT(*)) OVER (ORDER BY CAST(scheduled_departure AS DATE)
                                 ROWS BETWEEN 6 PRECEDING AND CURRENT ROW), 1) AS avg_7d
FROM flights
WHERE scheduled_departure >= '2026-08-01'
GROUP BY day
ORDER BY day
LIMIT 3;| day | flights | avg_7d |
|---|---|---|
| 2026-08-01 | 568 | 568 |
| 2026-08-02 | 558 | 563 |
| 2026-08-03 | 536 | 554 |
Window functions come up in most analyst interviews, so do not skip them. Start with SQL window functions, and keep the SQL cheat sheet open while you practise.
Stage 5: BI and visualisation
Pick one BI tool and learn it properly rather than three superficially. Power BI, Tableau and Looker Studio are all common; check which ones appear in job ads where you want to work. The concepts carry over: connecting to data, building a few charts, adding filters, publishing a dashboard.
More important than the tool is choosing the right chart: lines for change over time, bars for comparing categories, and almost never a pie chart with more than three slices. A dashboard should answer a specific question for a specific person, not show everything that can be measured.
Stage 6: business metrics
This is what separates an analyst from someone who knows SQL. Learn how the common metrics are defined and calculated, and practise computing them yourself:
- Funnels: what share of users go from one step to the next.
- Retention and cohorts: of the people who started in a given week, how many came back. See cohort retention in SQL.
- Revenue metrics: average order value, revenue per user, repeat purchase rate.
- Growth: week over week, month over month, and why partial periods distort them.
Learn these alongside stages 4 and 5, not after: they are the questions you will be writing SQL and building dashboards for.
Stage 7: Python, later
Python with pandas is useful for things SQL does poorly: complex data cleaning, statistical tests, automating a report, working with files and APIs. Many analyst roles list it. But many junior roles are mostly SQL, spreadsheets and BI, and learning Python before you can write a solid GROUP BY and JOIN tends to slow people down.
When you get to it, focus on pandas (loading, filtering, grouping, merging), Jupyter notebooks and basic plotting. You will notice that most pandas operations have a direct SQL equivalent you already know.
Stage 8: portfolio and interview prep
Portfolio
Two to four small, finished projects are worth more than ten half-done ones. A good project:
- starts from a question (“which routes have the most delays, and is it the route or the time of day?”),
- shows the queries you wrote,
- gives a short answer with one or two charts,
- states what you would check next and what the data cannot tell you.
Public datasets, or the practice databases in a course, are fine. What reviewers look for is clear thinking, not an unusual dataset.
Interviews
Analyst interviews usually combine:
- SQL tasks, often live: joins, grouping, a window function, an edge case with NULLs or duplicates. The SQL interview questions cover the typical ones.
- Case questions: “Bookings dropped 10% last week. How would you investigate?” They test whether you check the data first, break the number down by segment and think about causes.
- Statistics basics: interpreting an A/B test result, mean vs median.
- Talking about your projects: what you found and what you would do differently.
Practise solving SQL tasks against a timer and out loud. The SQL practice problems are a good set to start with.
What you can skip at the start
- Database administration: indexes, backups, permissions. Useful later, not needed to start.
- Machine learning: a different role. Basic statistics is enough for most analyst jobs.
- Several BI tools at once: one is enough until a job requires another.
- Advanced Python (classes, web frameworks): not part of an analyst’s daily work.
- Every SQL dialect: learn one (PostgreSQL is a good choice); the others differ in details you can look up.
Common mistakes on the way
- Watching instead of writing. Videos feel productive; writing queries that fail and fixing them is what builds the skill.
- Collecting certificates instead of projects. An employer wants to see what you can do with data.
- Learning tools without questions. Every query, chart and notebook should answer something specific.
- Skipping the data check. Count rows, look for duplicates and NULLs, and sanity-check totals before you report a number.
- Waiting to feel ready. Start applying once you can do stages 1–4 and have a couple of projects; interviews themselves are practice.
How to start this week
Open the Nomto SQL room and run your first query on the airline database: there is nothing to install. The course starts with an introduction to the data and moves through the basics in short lessons, each ending with tasks checked automatically. An hour a day, most days, gets you further than a long session once a week.
FAQ
Can I become a data analyst without a degree?
Many people do. Employers vary, but for analyst roles what you can show (SQL skills, a portfolio, clear reasoning in interviews) often carries a lot of weight. A degree in a quantitative field helps but is not the only route.
Should I learn SQL or Python first?
SQL. It is used in nearly every analyst role, interviews test it directly, and you can become useful with it faster. Add Python once you are comfortable with joins, grouping and window functions.
How long does it take to become a data analyst?
It depends on your background and how much time you put in. For someone starting from scratch at about an hour a day, six months to a year to be ready for junior applications is a realistic range. Prior Excel or numbers-heavy work shortens it.
Do I need to be good at maths?
You need comfort with percentages, averages, ratios and basic statistics, not advanced maths. Careful thinking about what a number means matters more than calculation.
Which BI tool should I learn?
Check job ads in the market where you want to work and pick the tool that appears most. Power BI, Tableau and Looker Studio are all common, and the concepts transfer between them.
Also in Español, Português (Brasil), Tiếng Việt, 简体中文