IELTS · Guides · October 24, 2026 · 3 min read
IELTS Writing Task 1 pie chart: how to describe shares, with a sample answer
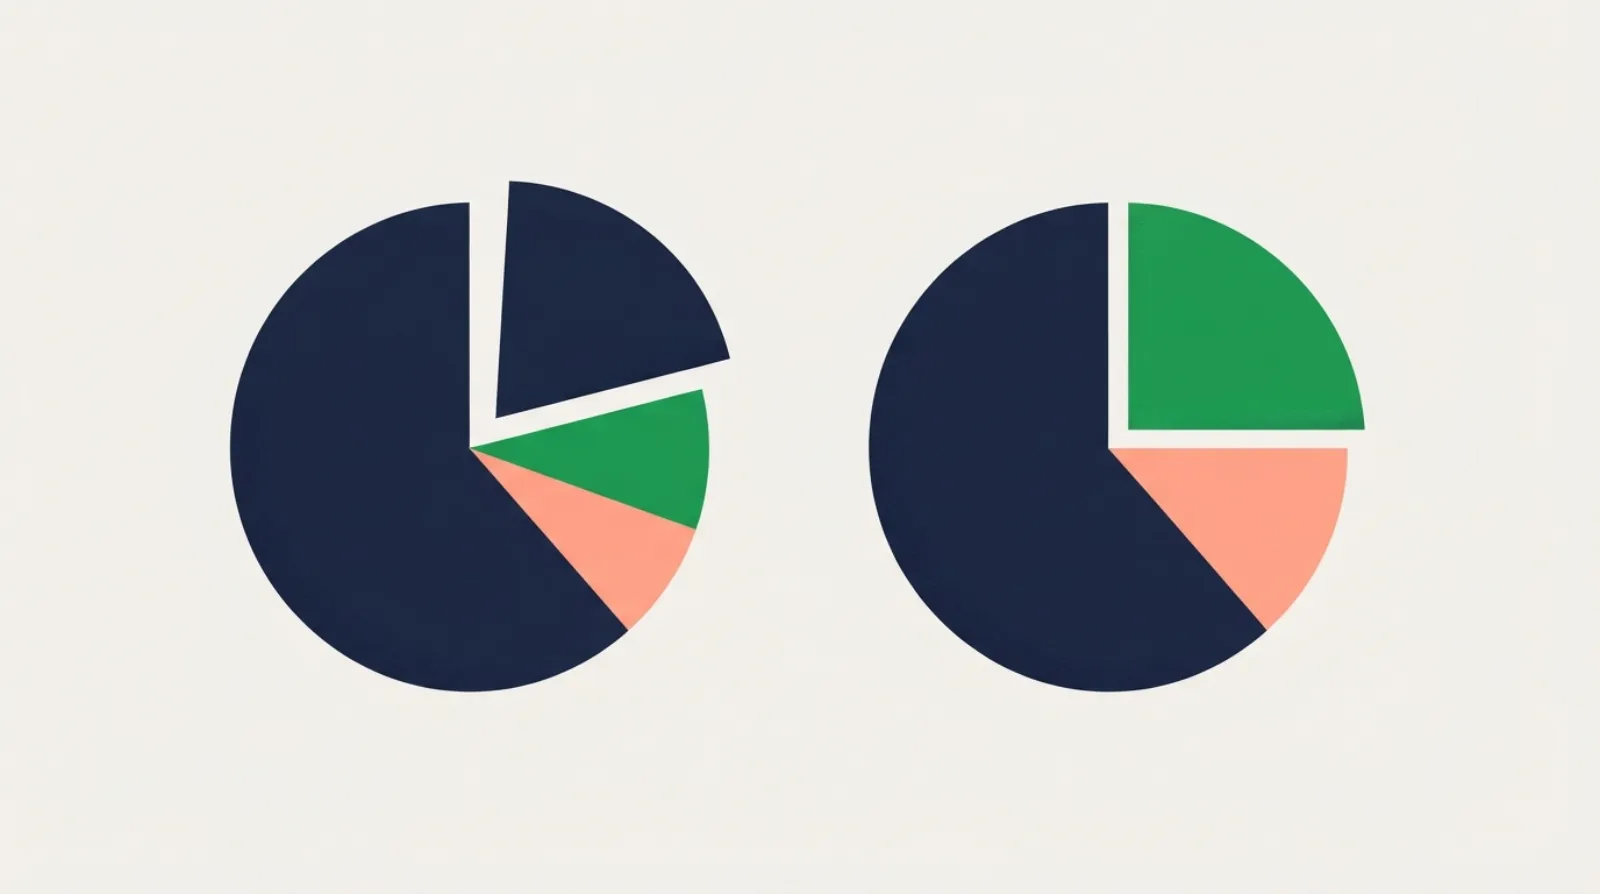
A pie chart shows how a whole is divided: how a budget is spent, where electricity comes from, what people do with their rubbish. IELTS usually gives two or three pies: two years, two countries, or men and women. The key is to compare the same slice across the pies, not to describe each pie on its own.
What to look for
- The largest and smallest slices in each pie.
- Which slices grew and which shrank between the pies, if they show different years.
- A change of leader: a slice that was largest in the first pie but not in the second is almost always worth putting in the overview.
- Slices that barely changed, which can be covered in one short sentence.
With one pie only, compare slices with each other, and group the small ones together.
Percentages and fractions
Mix percentages with words for proportions. It reads better and shows range:
| Percentage | In words |
|---|---|
| 50% | half |
| 48% | just under half |
| 34% | about a third |
| 25% | a quarter |
| 20% | a fifth, one in five |
| 9% | fewer than one in ten |
| 74% | nearly three quarters |
Also useful: accounted for, made up, represented, the largest share, the smallest proportion.
A model answer
Task: The pie charts below show how people in one city travelled to work in 2005 and 2025. Summarise the information by selecting and reporting the main features, and make comparisons where relevant.
| 2005 | 2025 | |
|---|---|---|
| Car | 52% | 31% |
| Bus | 24% | 22% |
| Bicycle | 6% | 19% |
| Walking | 11% | 12% |
| Working from home | 7% | 16% |
The two pie charts compare the ways in which people in one city got to work in 2005 and 2025.
Overall, the car remained the most common way of travelling to work, but its share fell sharply. Cycling and working from home both grew considerably, while the proportions using the bus and walking hardly changed.
In 2005, just over half of all workers drove to work, a figure that had dropped to 31% twenty years later. The bus was the second most popular option in both years, used by about a quarter of commuters in 2005 and by 22% in 2025. Walking also stayed at a similar level, at around 11–12%.
The most striking growth was in cycling, which more than tripled from 6% to 19%, moving from the least popular option to the third most common. The proportion of people working from home also rose substantially, from 7% to 16%, so that by 2025 almost one in six workers did not travel at all.
165 words. The overview names the leader, the two big risers and the two stable slices. The details then compare each slice across the two years instead of describing one pie and then the other.
Common mistakes
- Describing the first pie, then the second. The reader has to do the comparison. Compare each slice across years in the same sentence.
- Trend verbs for one pie. With a single pie there is no change, so write accounted for, not increased to.
- Every slice at the same length. Big changes get a sentence each; slices that barely moved can share one.
- Percentages that do not add up when you paraphrase. Just under half is not 52%.
Practise in the practice room
Write an answer and get band scores for all four criteria with comments:
The four-paragraph structure for every chart is in the Writing Task 1 guide. When the pie comes with a table or a bar chart, describe each visual briefly and link them; the table guide shows how to pick key figures.
Common questions
Should I mention every slice? Yes, if there are five or six. With eight or more, group the small ones: the remaining categories each accounted for less than 5%.
Do I need to write the percentages? Use some, but not for every slice. Words like a quarter and just over half are just as clear and show a wider range of vocabulary.
One paragraph per pie? Only when the pies show different things (for example, men and women) and comparison is hard. Even then, end with a sentence that compares them.
Also in Türkçe